LINUX性能监测工具-02-侵入式
1.介绍
侵入式的性能检测工具,顾名思义即需要修改代码才能使用。
在商业领域有OProf,由于是收费的,因此应用并不广泛,我本人也没用过,因此不再介绍。
在开源领域有gprof(g for GNU),gcc编译器自带了该工具。虽说不用显式的修改源代码(编译时添加-pg选项即可),但编译出来的程序不能直接用于生产运行,因此也算是侵入式的。
gprof虽然是免费的,还有GNU官方背书,但有几个致命缺陷:一是不支持多线程应用,只能分析主线程性能;二是不支持跟踪动态库中的函数调用情况。
今天给大家介绍一个g开头的性能分析工具-google performance tools,功能完备,支持多线程下的性能分析,工具链也比较完善,能生成火焰图等直观炫酷的结果展示形式。
2.安装
在Redhat下使用如下命令安装(包含火焰图等图形生成工具):
yum install gperftools
yum install pprof
yum install graphviz
git clone https://github.com/brendangregg/FlameGraph.git
在Ubuntu下使用如下命令安装:
apt-get install google-perftools
git clone https://github.com/gperftools/gperftools.git
apt-get install libgoogle-perftools-dev
git clone https://github.com/brendangregg/FlameGraph.git
3.使用
a) 源码及编译
在源代码中应该包含如下几个要素:
- 包含头文件:gperftools/profiler.h
- 准备开始搜集性能数据时,调用:ProfilerStart(“gperf_capture.prof”)(参数是保存性能数据的文件路径)
- 如果需要分析线程的性能数据,在需要分析的线程中调用:ProfilerRegisterThread()
- 结束分析时,调用ProfilerStop()(注意,用户只有调用了该接口,性能数据文件中才会有数据,程序正常或异常退出时,性能数据文件中不会自动写入数据)
下面展示了一个简单的例子:
#include <gperftools/profiler.h>
#include <pthread.h>

// g++ -o gperf_test gperf_test.cpp -lpthread -lprofiler

void* thread_func_1(void* p_arg)
{
    ProfilerRegisterThread();

    long loop = 4000000000;
    while(loop--)
        ;

    return NULL;
}

void* thread_func_2(void* p_arg)
{
    ProfilerRegisterThread();

    long loop = 4000000000;
    while(loop--)
        ;

    return NULL;
}

int main()
{
    ProfilerStart("gperf_capture.prof");

    pthread_t thr_id_1, thr_id_2;
    pthread_create(&thr_id_1, NULL, thread_func_1, NULL);
    pthread_create(&thr_id_2, NULL, thread_func_2, NULL);
    pthread_join(thr_id_1, NULL);
    pthread_join(thr_id_2, NULL);

    ProfilerStop();

    return 0;
}
我们启动了两个线程,在每个线程中各跑一个空循环,循环结束后退出。
注意:编译的时候,要加上-lprofiler选项。
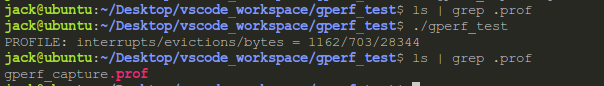
b) 运行生成性能分析文件
添加-lprofiler编译链接生成程序后,还需要实际运行一次,才能生成性能数据文件。
c) 图形化展示
使用pprof脚本,可以基于上面生成的性能数据文件生成图形文件:
./gperftools/src/pprof ./gperf_test gperf_capture.prof --svg >func_call.svg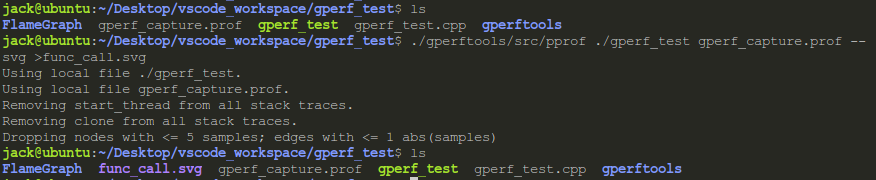
注意:Redhat系统下,调用pprof不用那么麻烦,直接pprof就行
生成的图形效果如下:
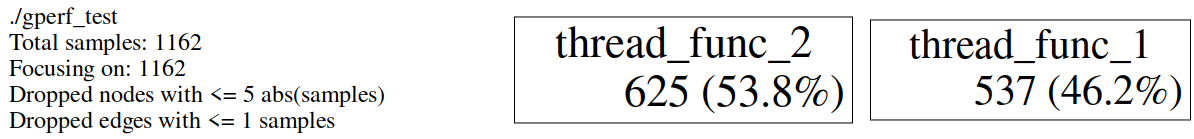
可以看到,两个线程各占了大约一半的执行时间。
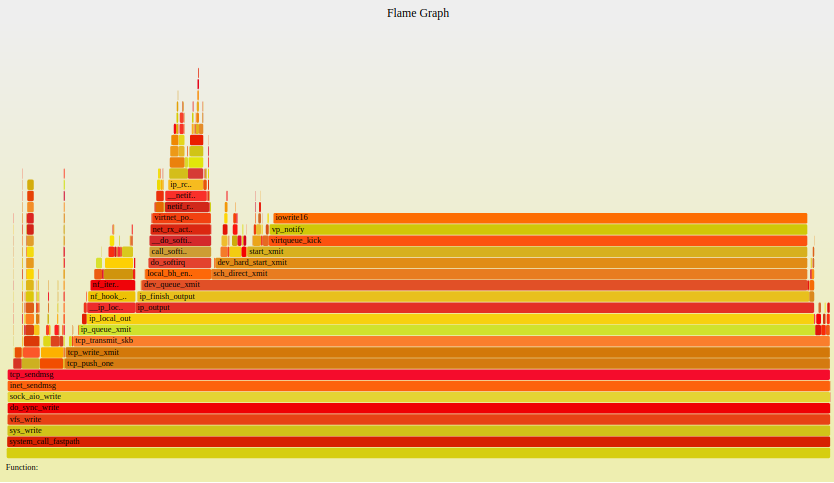
除了上面的这种函数调用图外,还能用FlameGraph工具生成炫酷的火焰图:
风格1:
./gperftools/src/pprof ./gperf_test gperf_capture.prof --collapsed > func_call.cbt
./FlameGraph/flamegraph.pl func_call.cbt > flame_1.svg
效果如下:

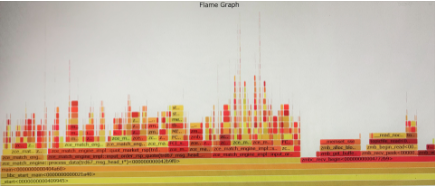
风格2:
./gperftools/src/pprof ./gperf_test gperf_capture.prof --collapsed > func_call.cbt
./FlameGraph/flamegraph.pl --invert --color aqua func_call.cbt > flame_2.svg
效果如下:

区别是展示调用栈的方向不同。
注意:将上述svg图形用浏览器打开,鼠标移动到对应的函数时,屏幕会显示关于该函数的全部信息。
由于我们的例子程序太过简单,因此展示的效果不太震撼,给大家看看其他的几个例子: